
Growth Lab
BI Group's growth team ran its experiments on a Trello board that had grown to 1,432 cards. I designed an internal tool to replace it, shaped around how an experiment runs, and built it myself with AI.
- BI Group, internal
- Designed it and built it with AI
- The growth team, about 15 people
- 2026
- Rolled out in October 2026. No results measured yet.
- From the demo, with made-up data, translated into English for this case. The team works in the Russian version.
Context · Discover · Before
1,432 cards on one Trello board
BI Group's growth team is about 15 people. From May 2024 the team kept its experiments on one Trello board, and by October 2026 it held 1,432 cards.
Trello is built for tasks. This team works in experiments, where a hypothesis goes through a test and ends in a decision. I talked to people across the team, from CVM, targeting, brand and product, about how they used the board. Five problems came up.
- The board grew every quarter, and your own hypotheses were hard to find among everyone else's.
- A card had no fields for an experiment, so everyone wrote up the hypothesis, metric, result and decision in their own way.
- At the end of each quarter everyone copied their experiments into Excel by hand to send to the lead for approval.
- Nobody could see how much they had in progress, in ideas or done against the quarterly norm.
- Results of past experiments got lost, and the team re-ran things that had already been tested.
All five come from the same place: a Trello card is made for any task, not for an experiment. The team needed a tool where a test has its own structure, not a general-purpose card.
Develop · Board
Columns for the stages of a test
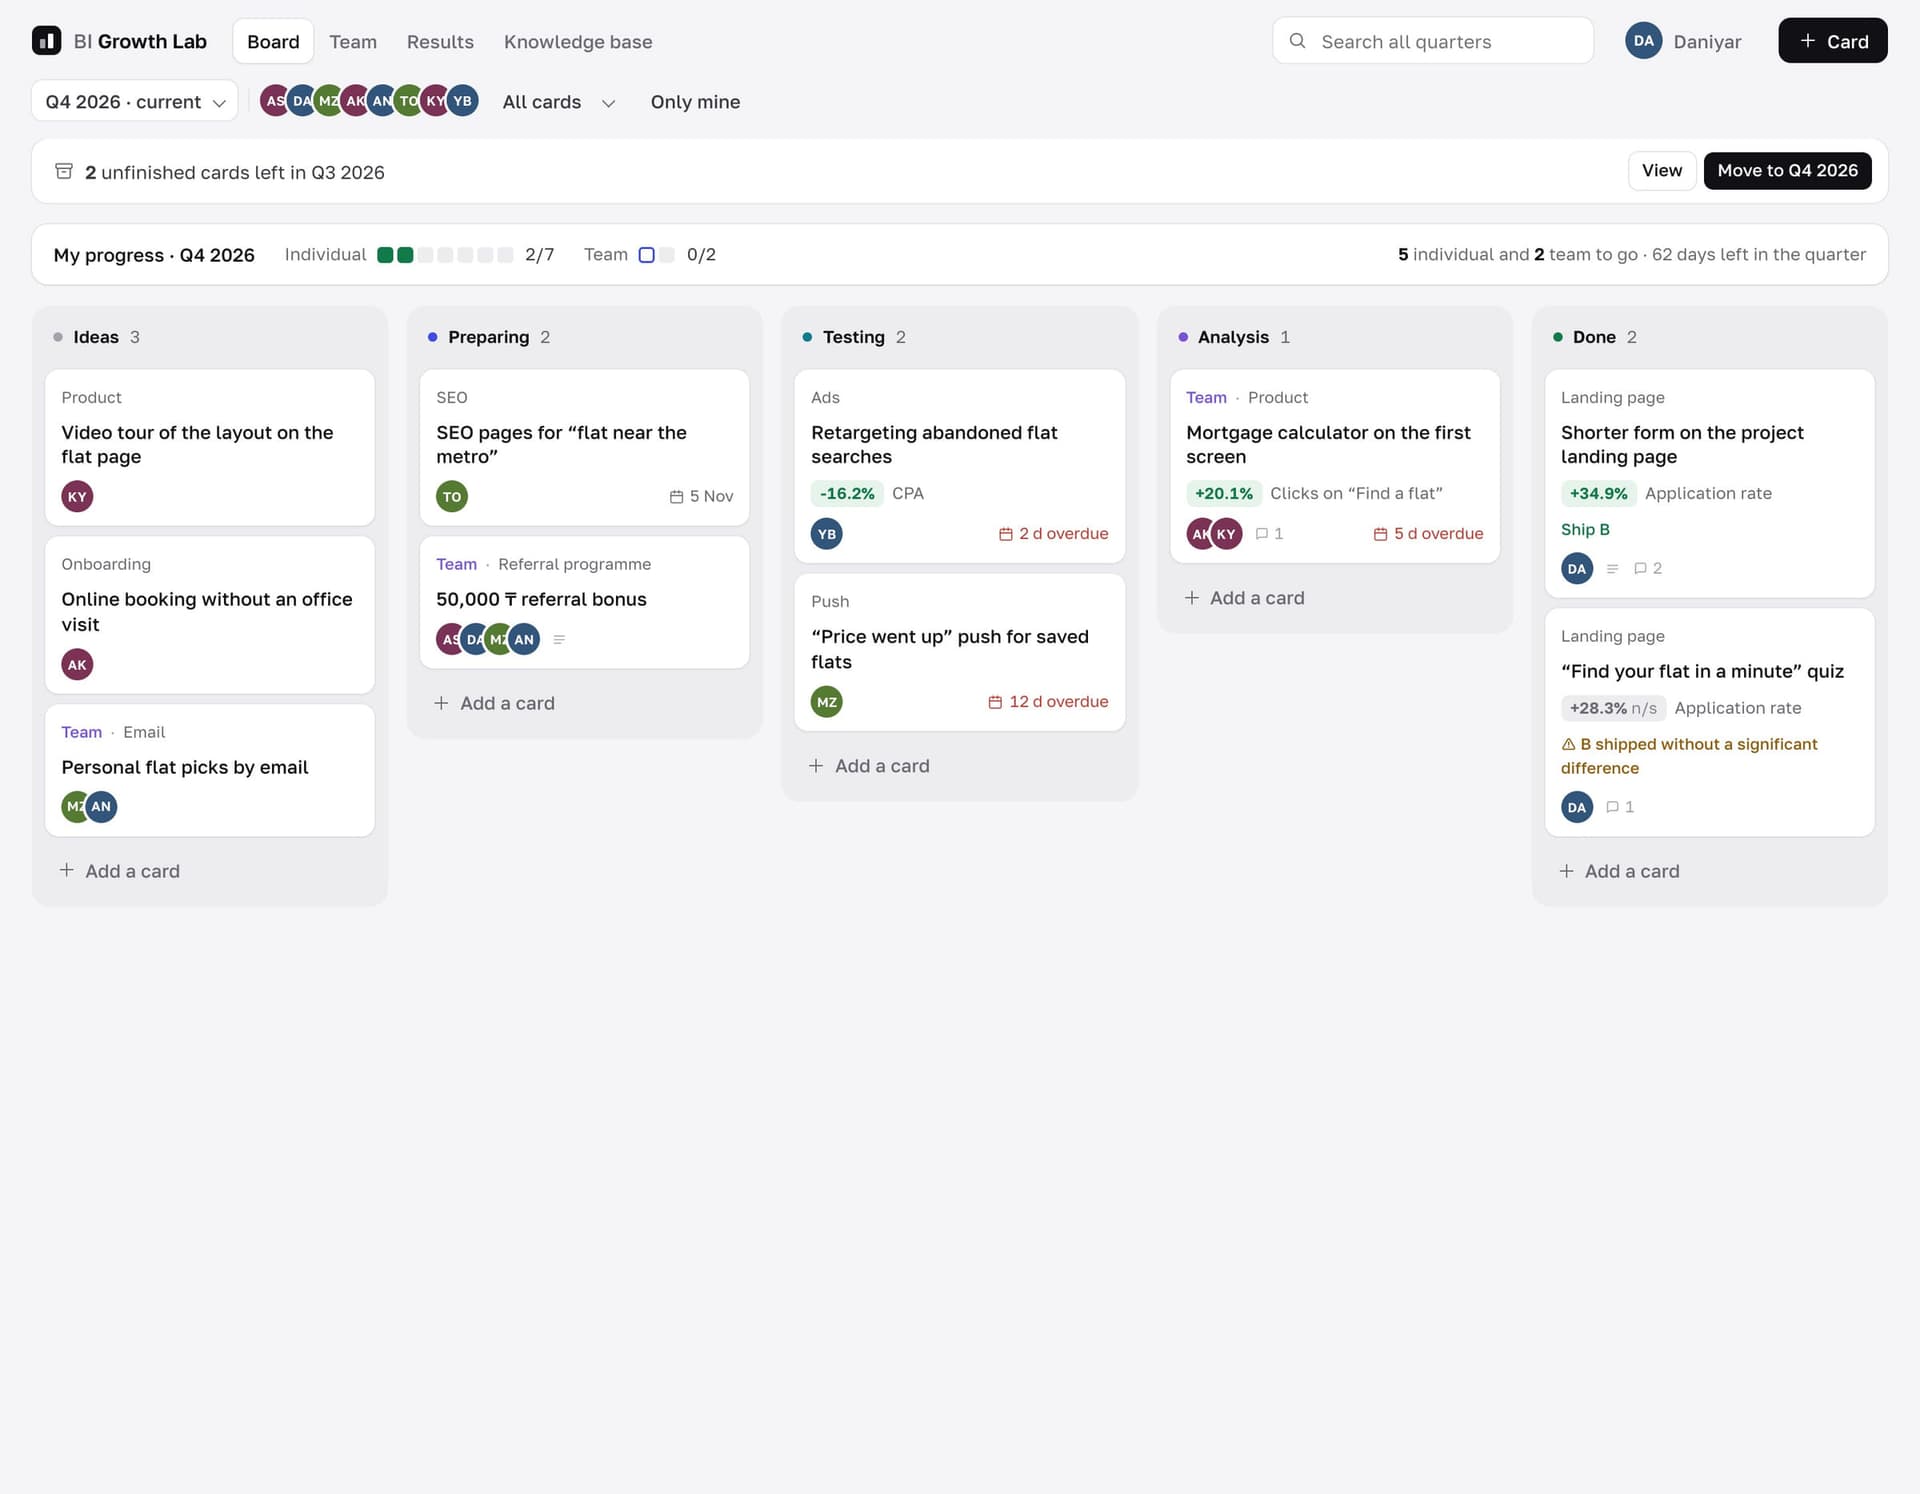
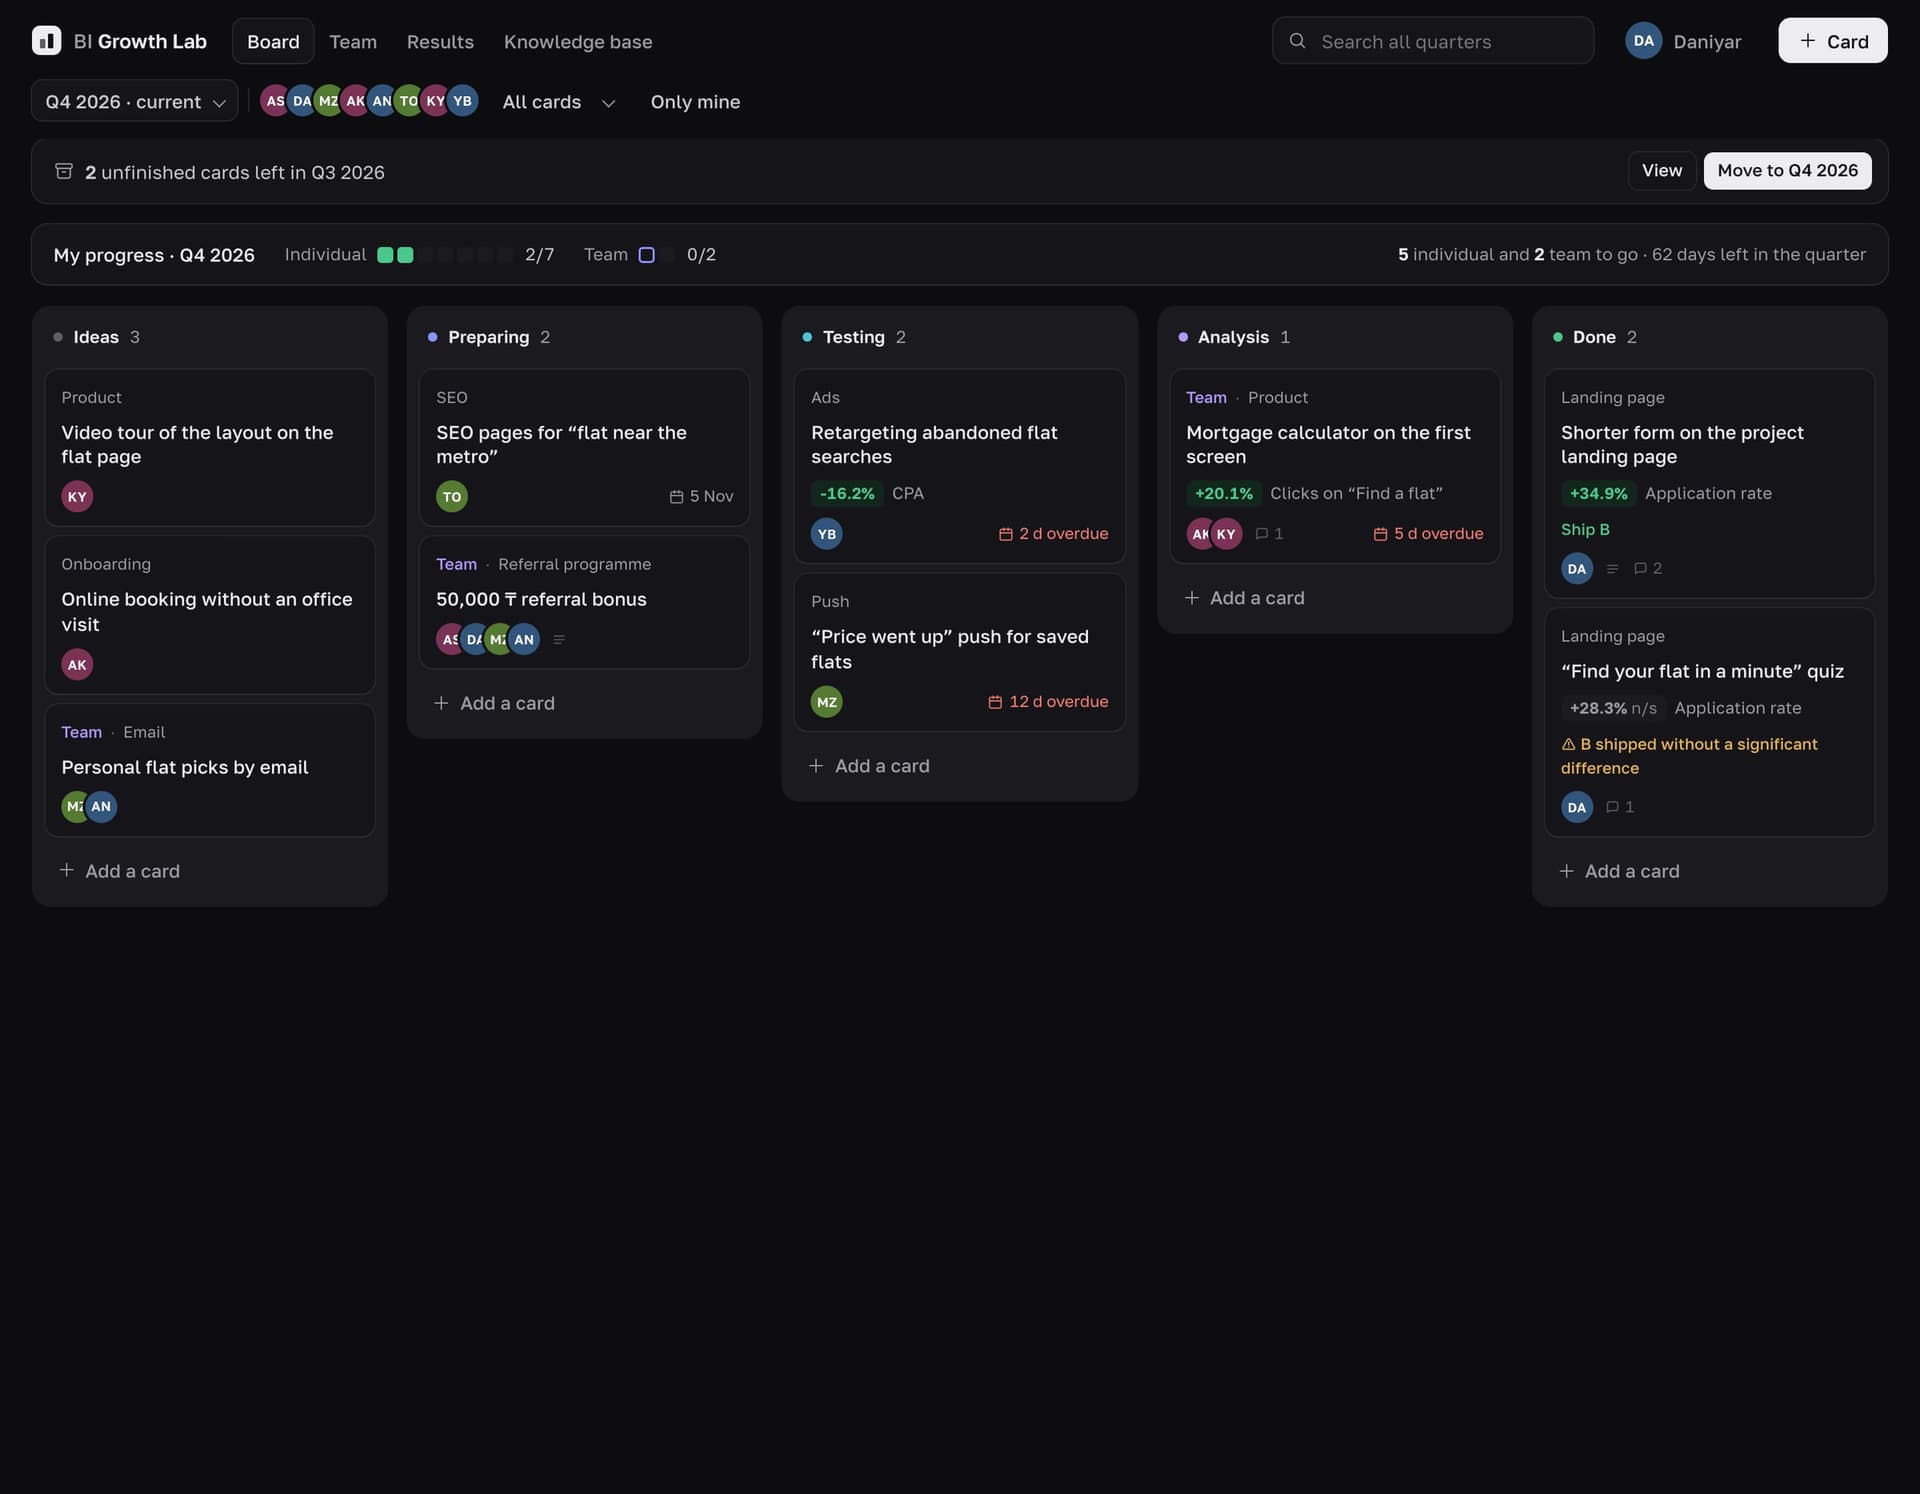
I kept the way the team already worked in Trello, so moving over would be easy. Cards sit in columns under the names the team used there and are dragged from one column to the next. A new card is added at the foot of a column, and an open card shows its comments and activity at the side. On top of that I added what Trello lacked, such as the results table, the team's progress against the norm and the export.
The board has five columns, one for each stage of an experiment, from idea to done. A strip above it shows how many of your experiments are done, how many are still to do and how many days are left in the quarter. "Only mine" hides everyone else's cards.
Work is split into quarters. A past quarter becomes an archive, and the cards left unfinished in it move to the new one in one click.
Develop · Card
Every card asks the same questions
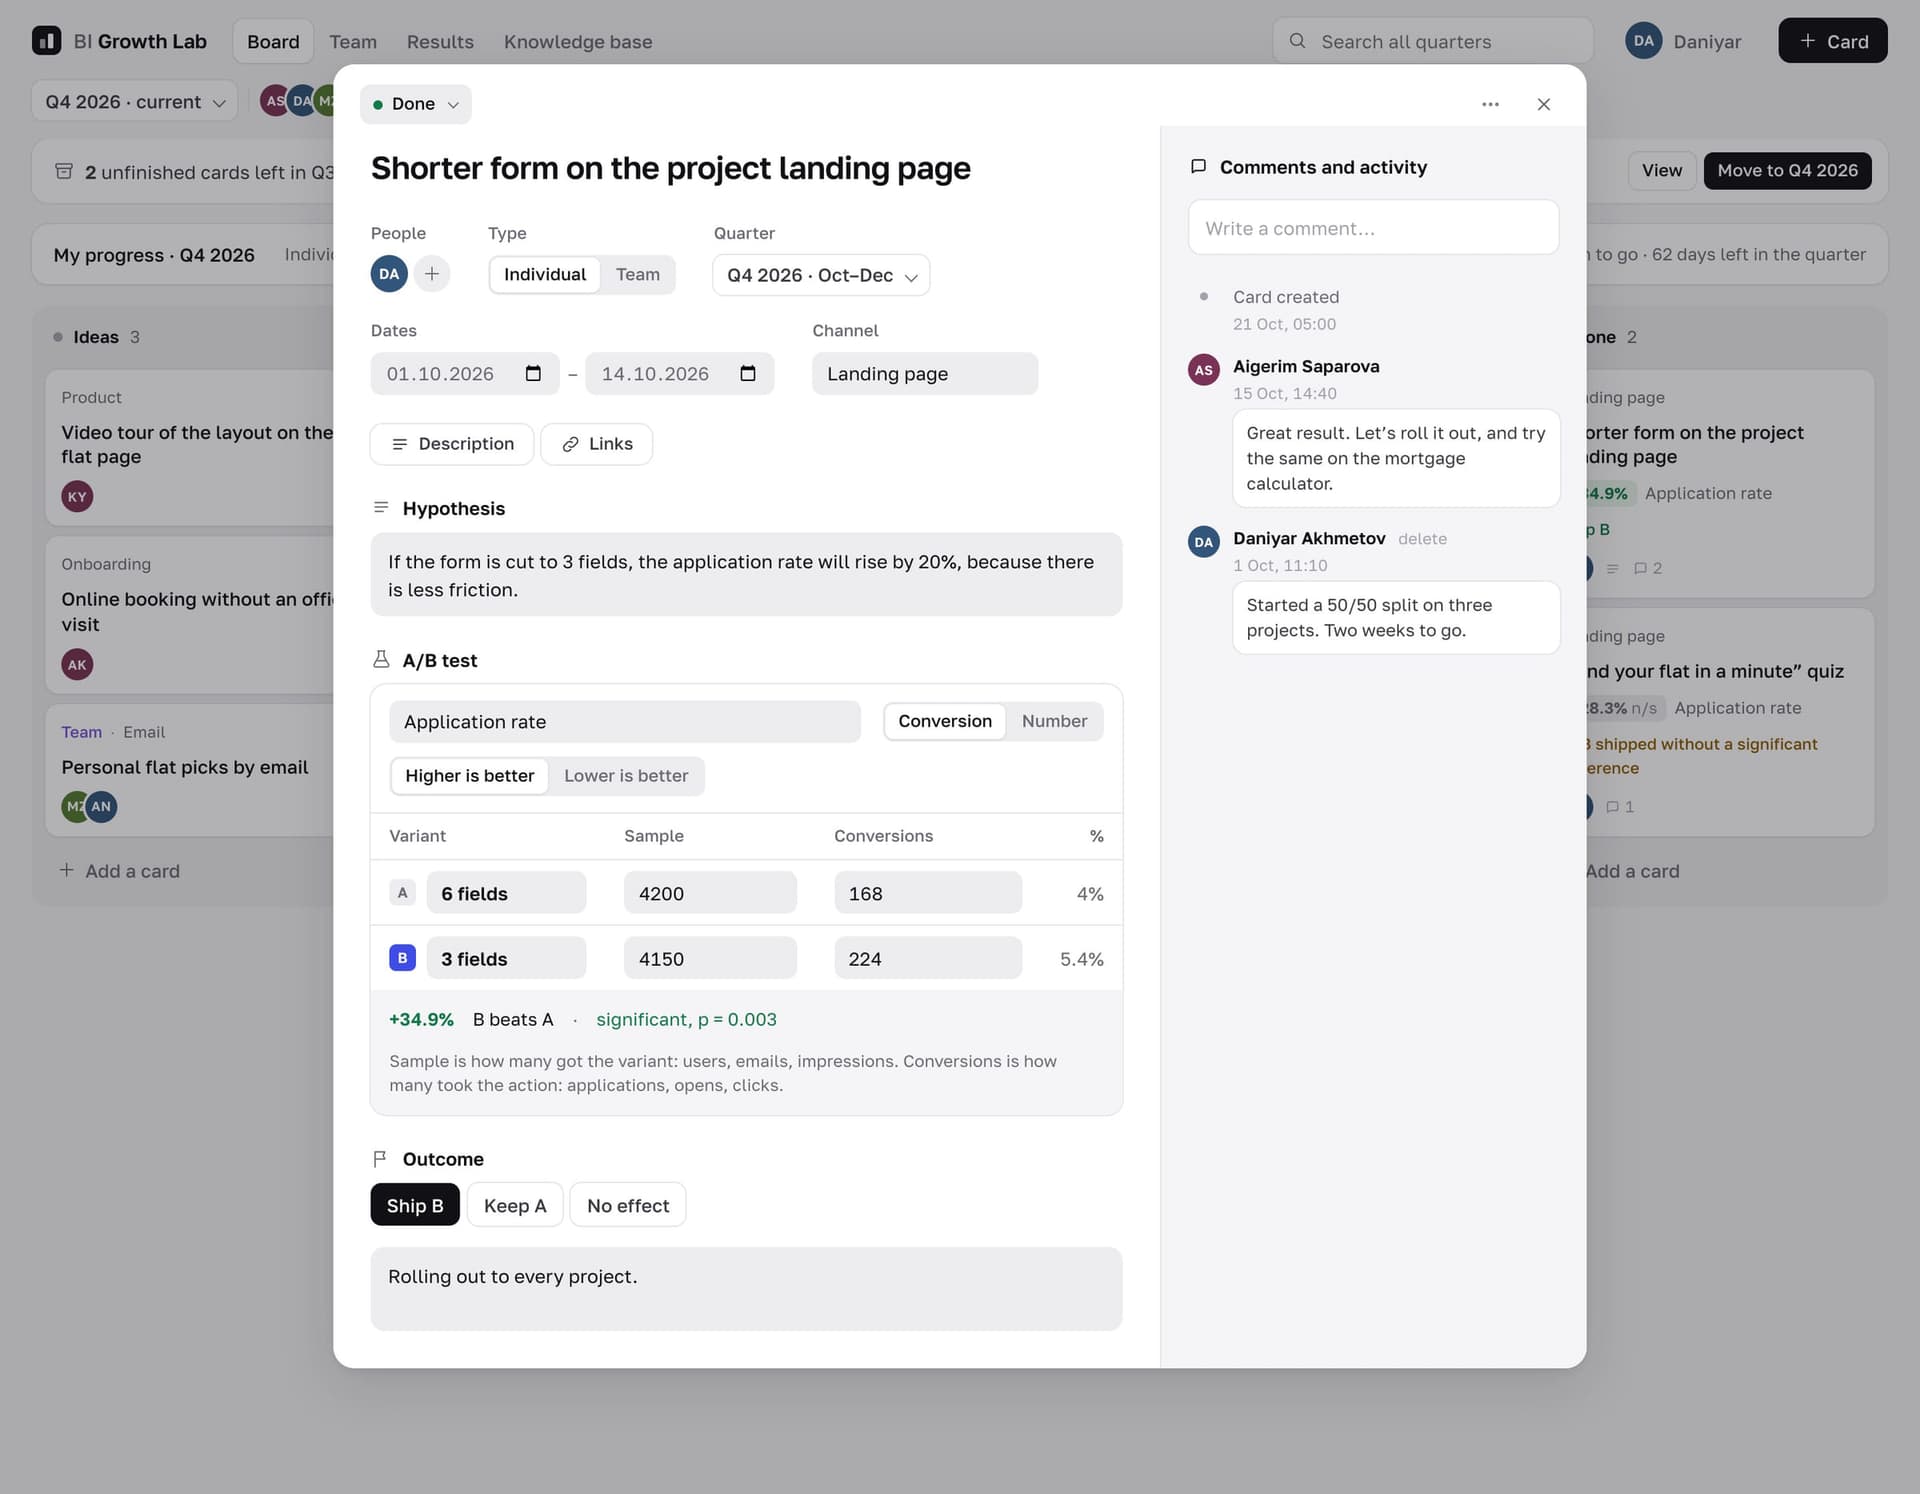
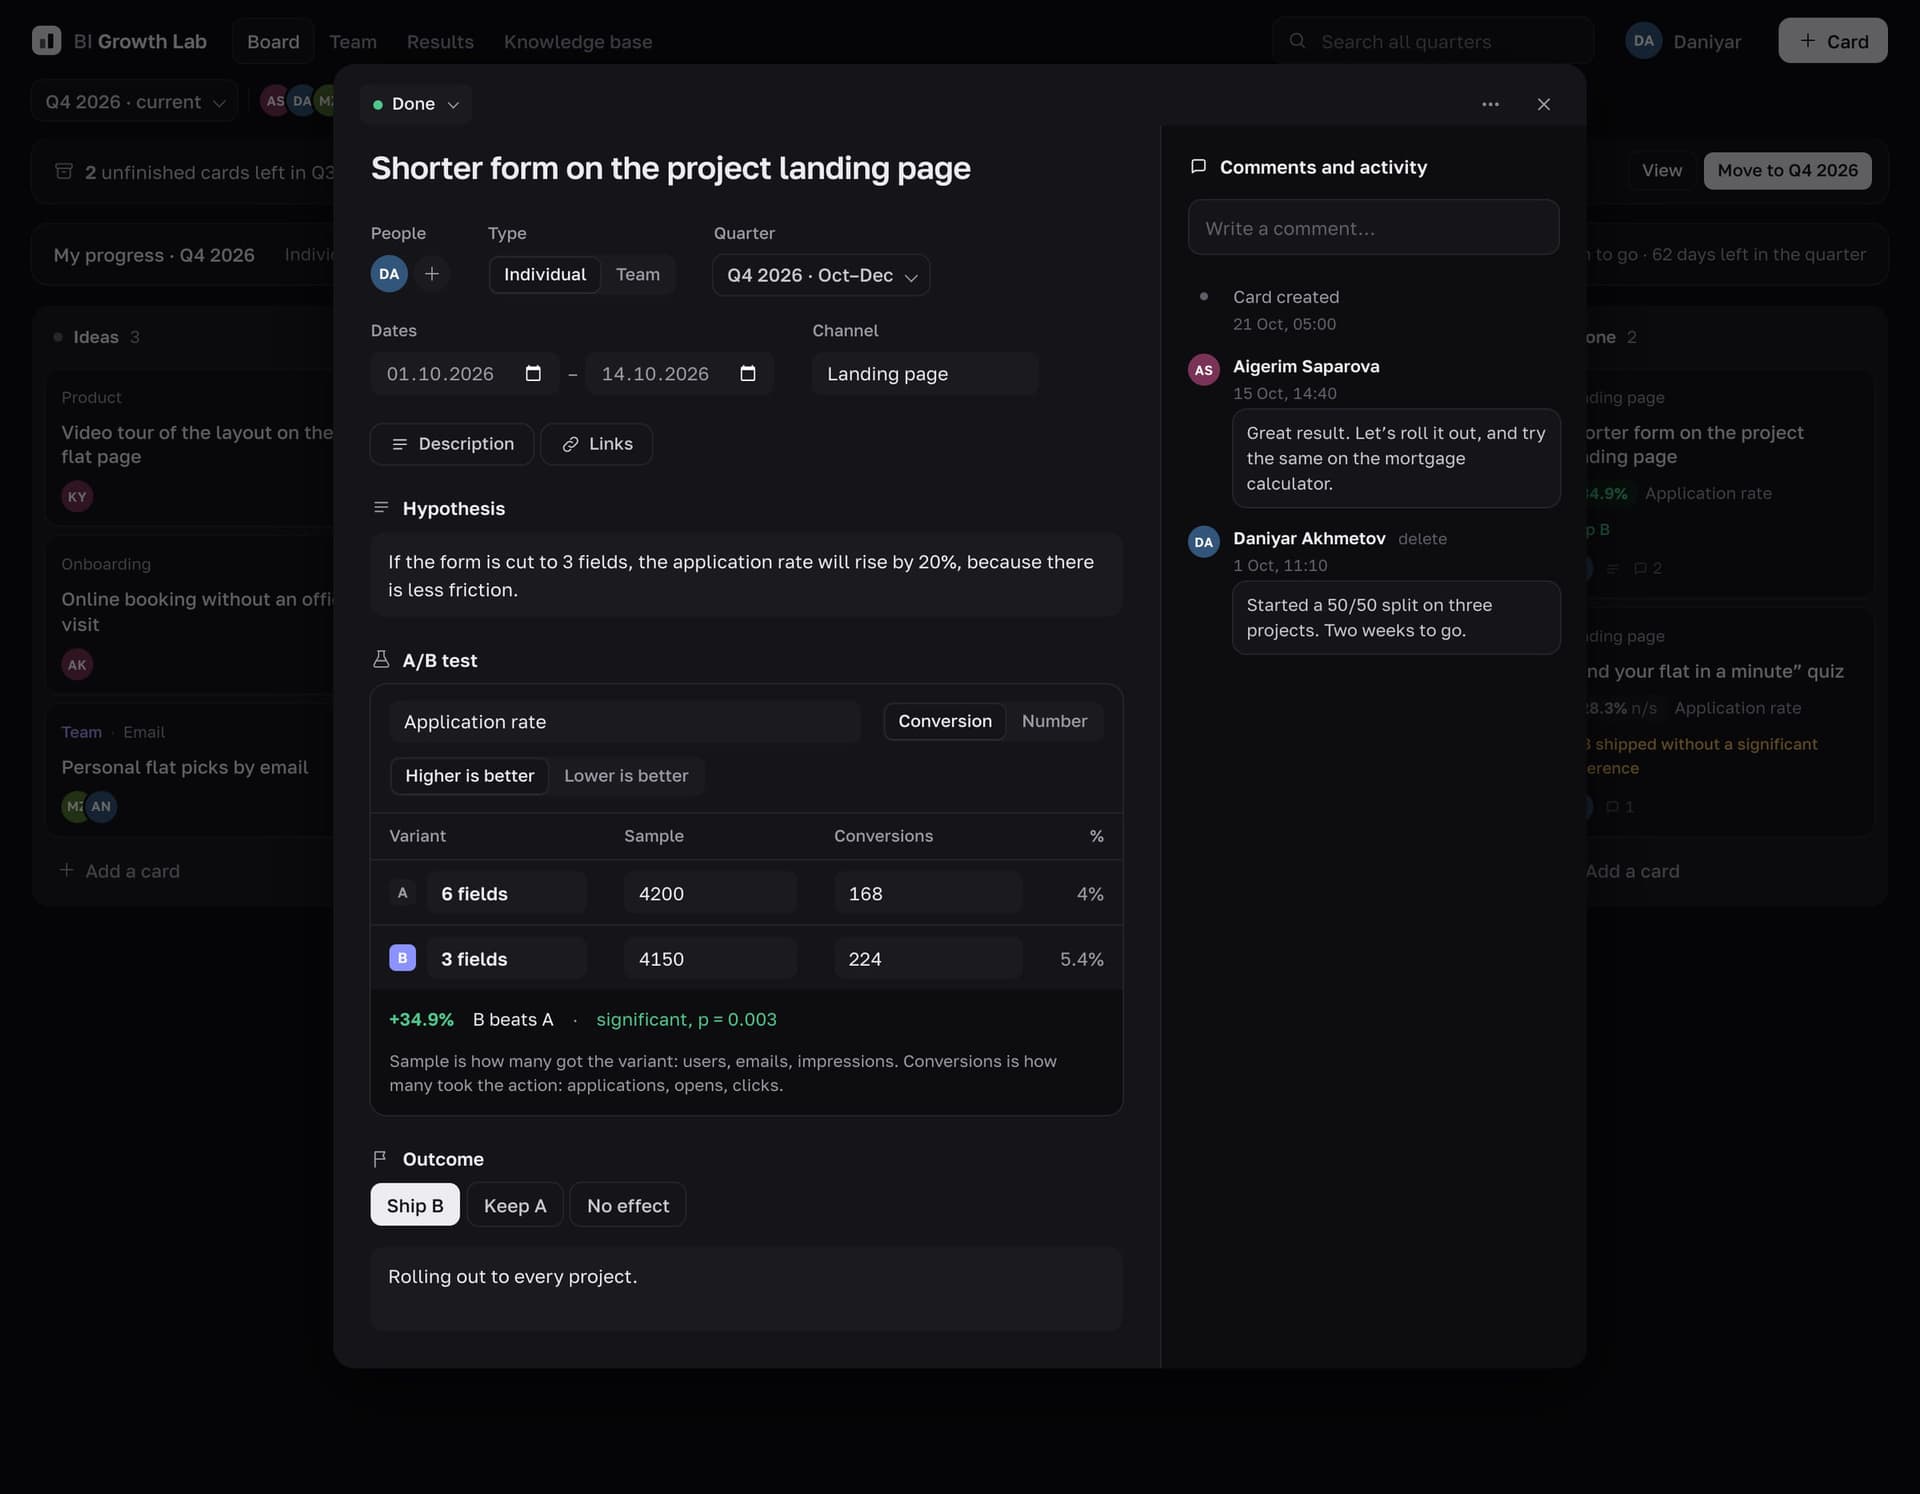
A card opens as a sheet with a fixed place for the hypothesis, the A/B test with its metric and numbers, and the outcome. The outcome is ship B, keep A or no effect. Every experiment is written up the same way, so they can be found and compared later.
Develop · Results
A test ends in a number and a decision
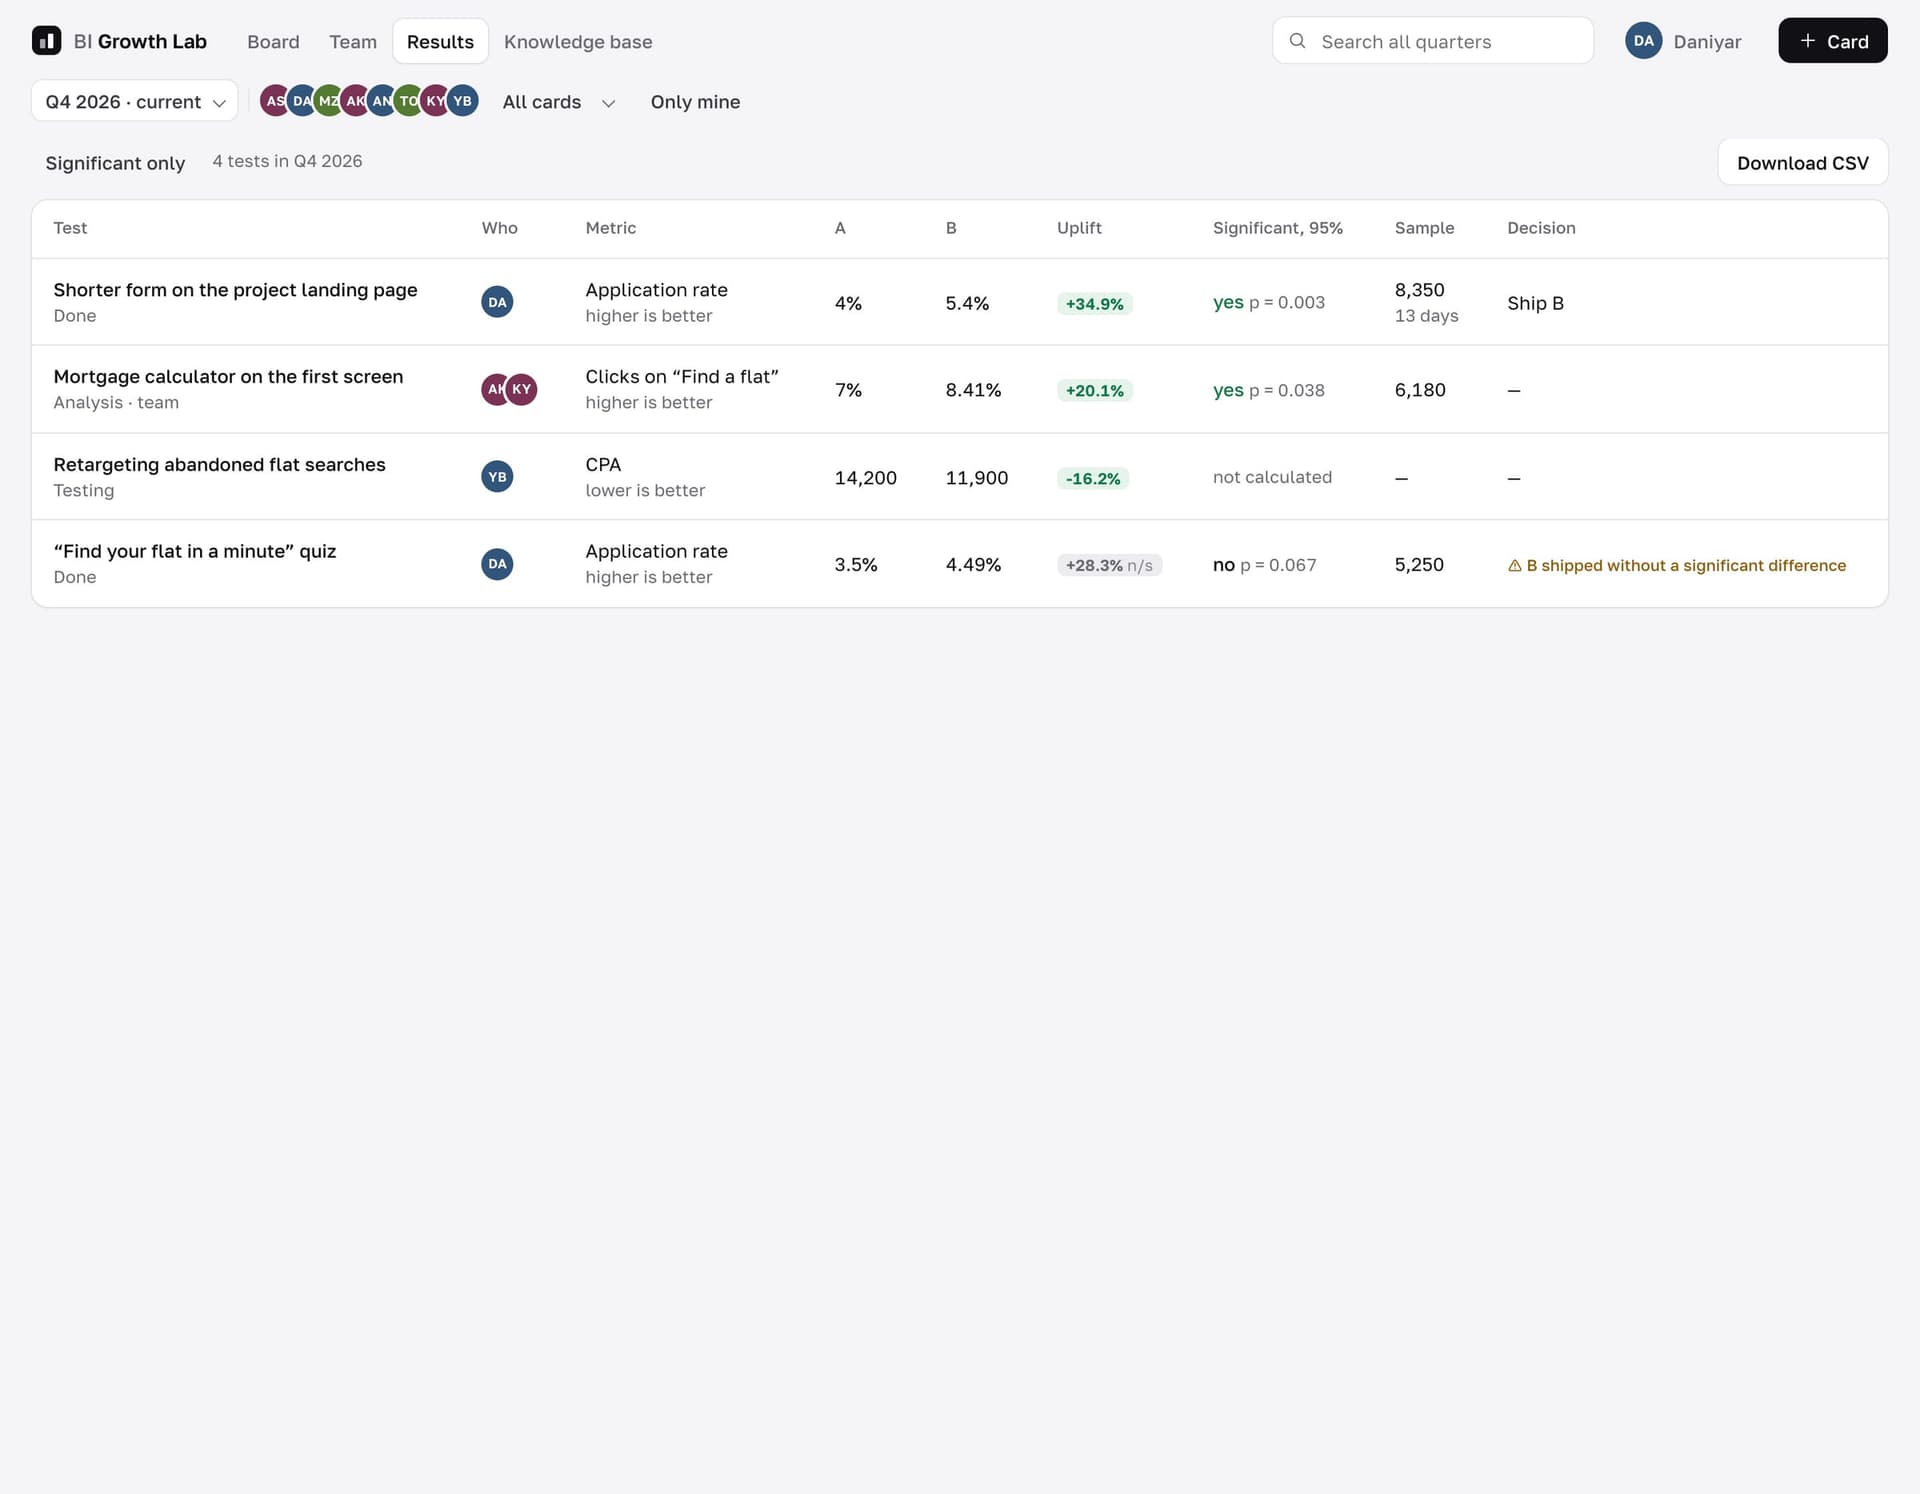
The Results tab puts the quarter's tests in one table, each with its metric, the figures for A and B, the uplift, whether the difference is significant, and the decision. A test shipped without a significant difference gets a warning.
The same table is a one-click export, ready to open in Excel and send to the lead for quarterly approval, so nobody has to copy it by hand.

Develop · Team
The quarterly norm counts itself
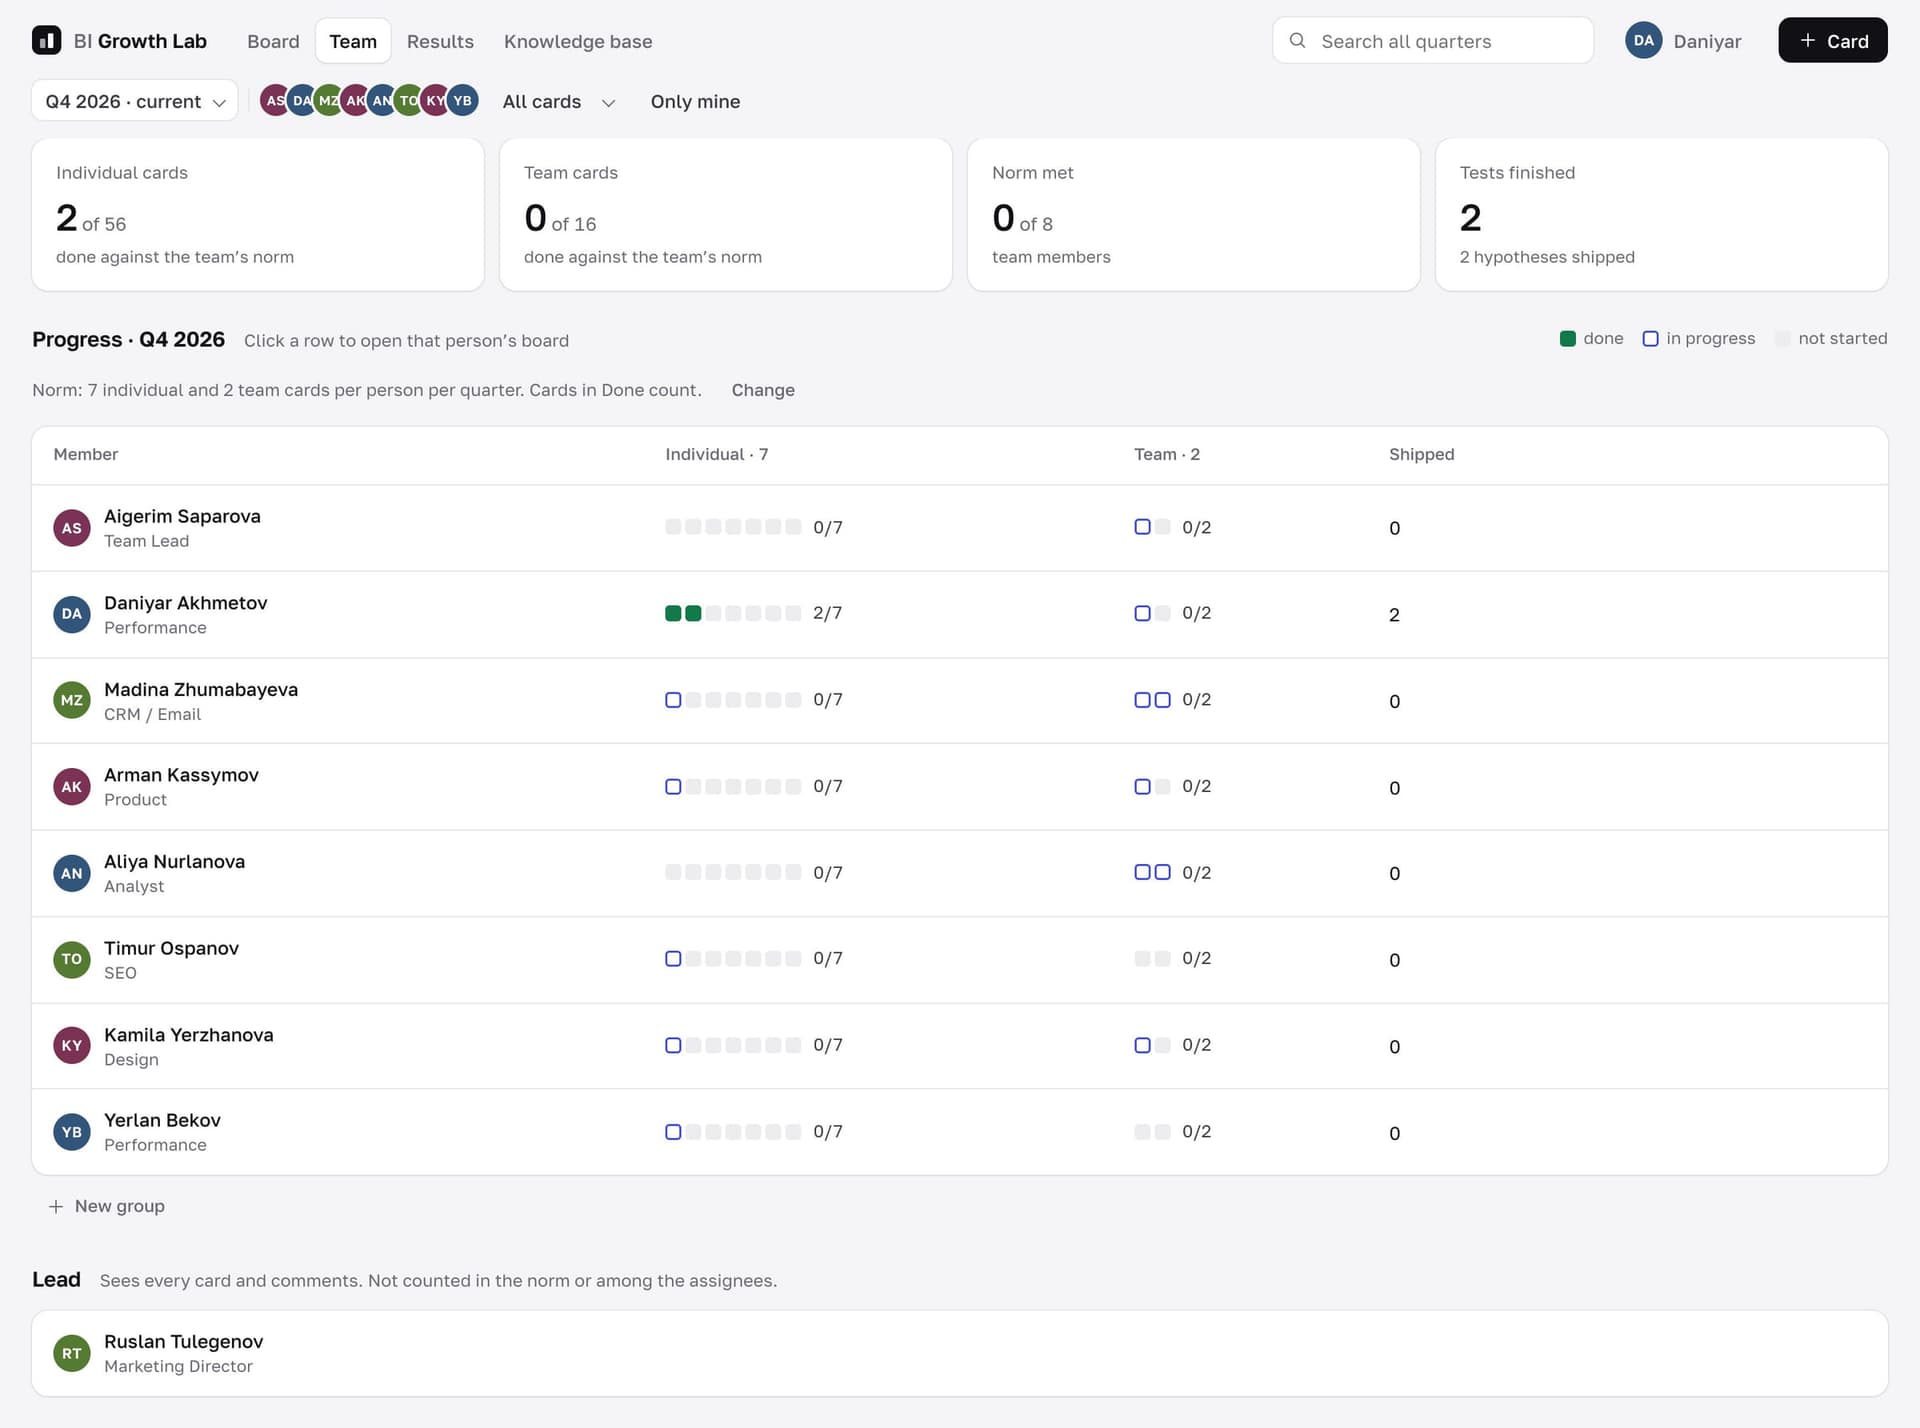
Each person is expected to finish seven individual and two team experiments a quarter. The Team tab counts them from the cards in Done, person by person, and shows what is still in progress.

Develop · Knowledge base
The old board stays, and it can be searched
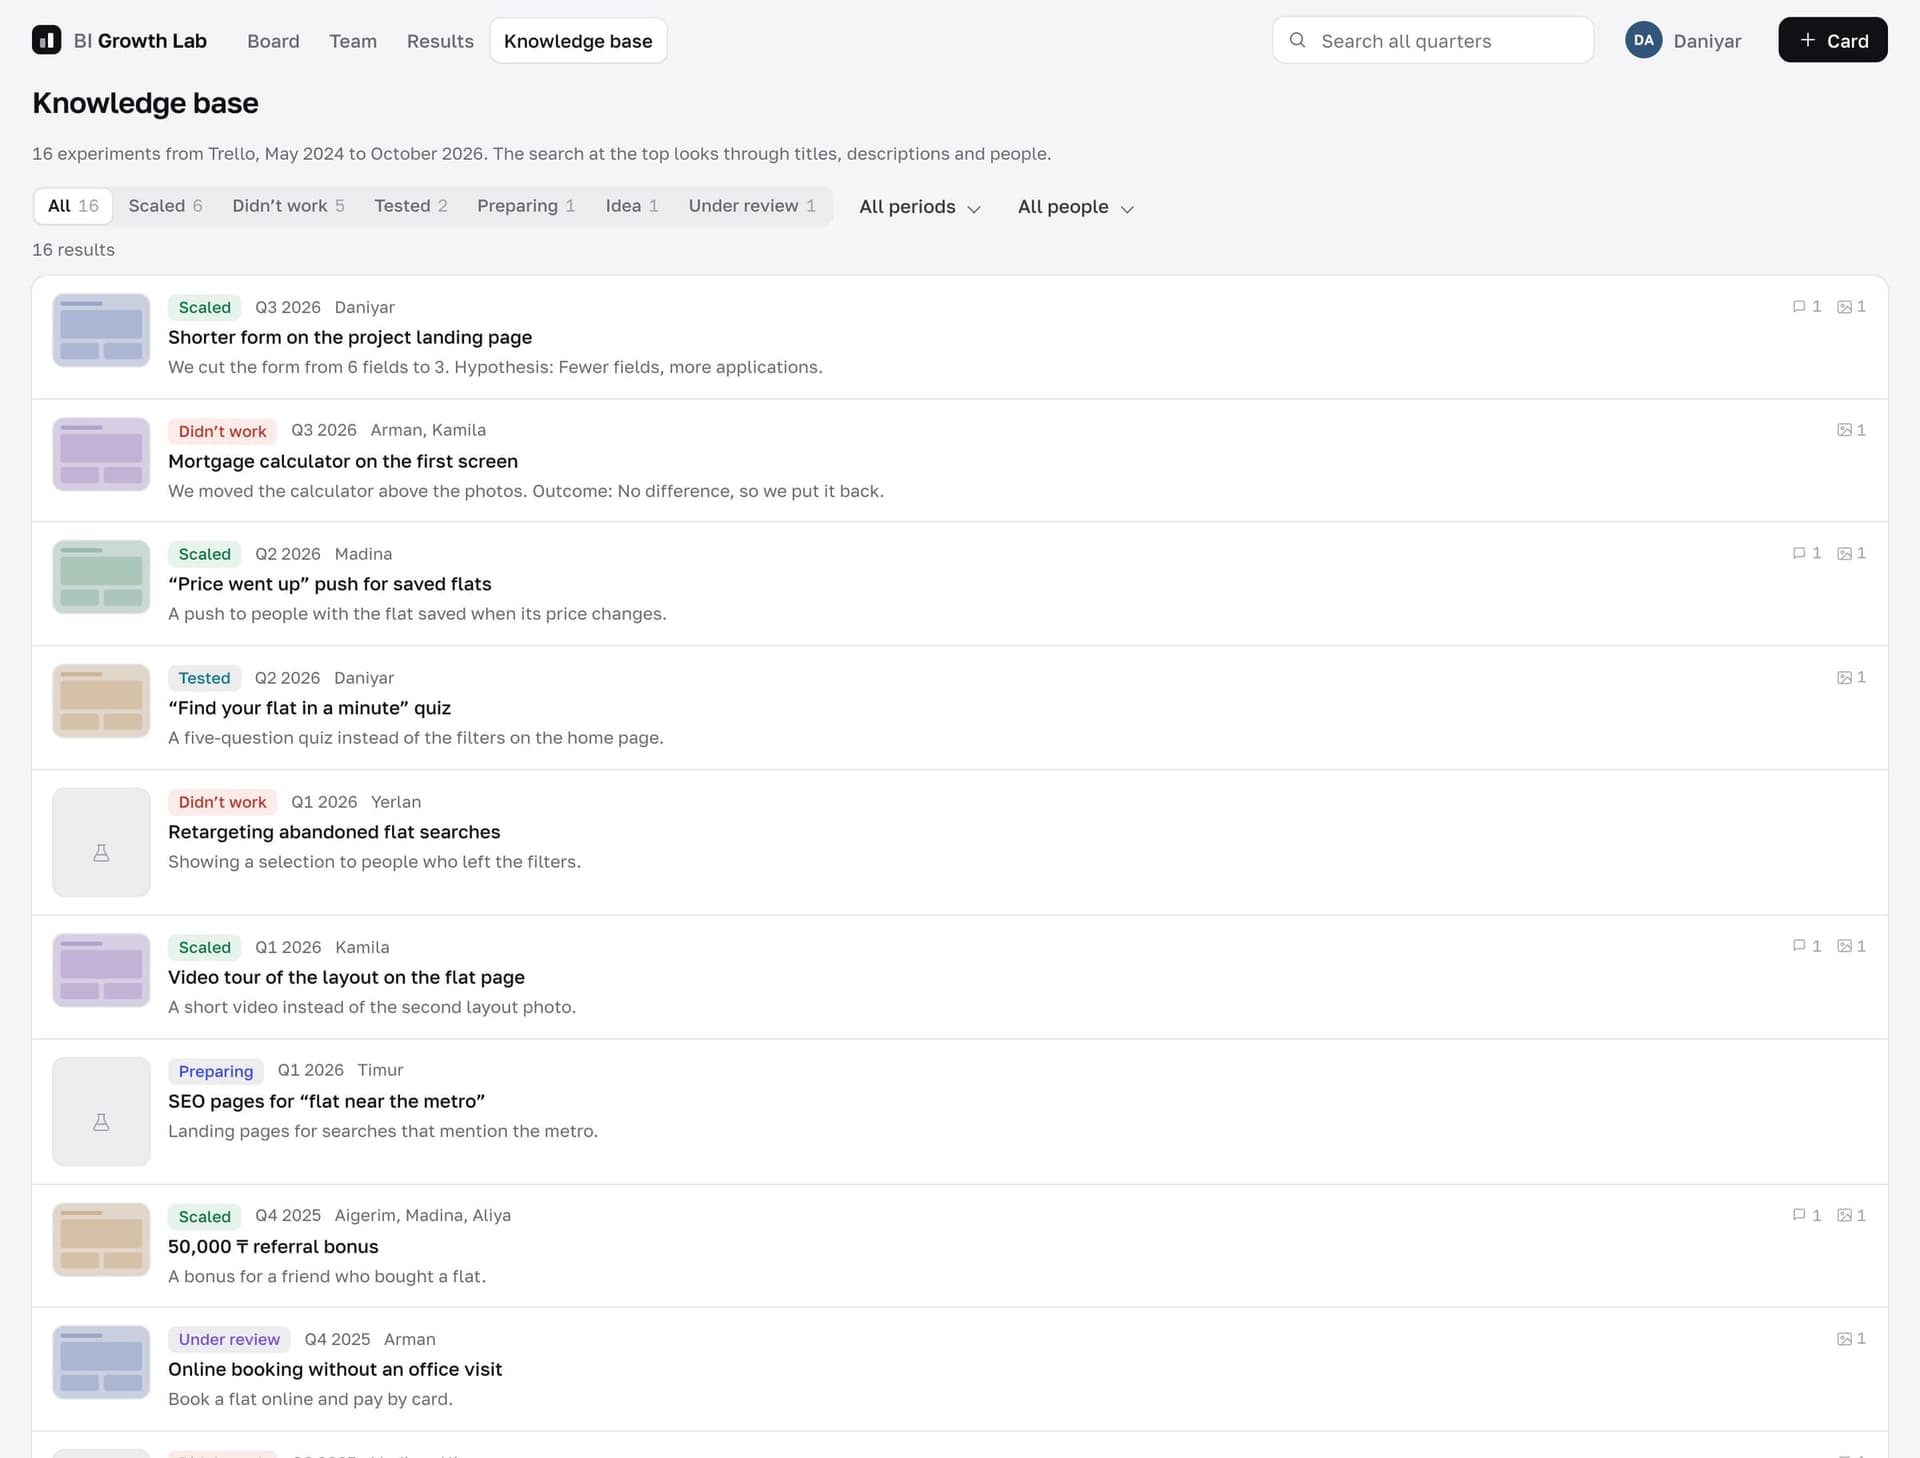
The Knowledge base tab holds all 1,432 cards from the Trello board as a read-only archive. It can be searched and filtered by outcome, quarter and person, so before testing an idea you can check whether someone already has.

Deliver · How it was built
AI wrote the code, I made the decisions
I built it myself with AI, which wrote the code. What the tool does and how it looks were my decisions.
There is no login; you pick yourself from the team once. Optional fields appear only when you add them. The activity feed records comments, new cards and moves between columns, and leaves out small edits, which only added noise.
Impact · Status
With the team, no results yet
The team started using it in the last week of October 2026. I'm collecting their feedback and changing the tool as it comes in. I don't have numbers yet on time saved or on experiments that weren't repeated.